By Tricia Rodrigo
An overwhelming majority of Editors Guild members believe that discrimination occurs in the edit bays, dub stages and other places where they work, and most do not feel safe reporting discriminatory behavior to higher-ups, according to a new survey commissioned by the Guild’s Board of Directors.
Meanwhile, the survey found that despite the publicity surrounding industrywide diversity efforts, gender and ethnic representation within the Guild itself has remained basically unchanged compared to four years ago.
Last summer’s 2020 Editors Guild Demographics and Workplace Survey drew record participation from the membership, allowing the union to examine gender, ethnicity, sexual orientation, age, and even pay within the union (complete details will be online at cinemontage.org).
Guild staff and member-volunteers reached out to members via ThruText, a person-to-person communication application. Collectively, they texted 7,859 members over the span of a week and a half. The effort drew a record-breaking response from 3,583 members, or more than 47% of the total membership.
COVID-19 resulted in an industrywide shutdown of the film and TV businesses, and the death of George Floyd and other racially-tinged incidents sparked social unrest over the summer. This spurred the Board to conduct a survey to address the issues of inclusion and discrimination. The Diversity Committee’s 17-member Survey Task Force, led by Women’s Committee Chair Dorian Harris, ACE, spent a month discussing and creating a 14-question survey which went out to members on July 31, 2020.
Guild officials say the results prove the need for more work on diversity and inclusion.
“It is apparent to me the Guild needs to build a real support system for our BIPOC members, as well as women, LGBTQ+ community and people with disabilities, both visible and invisible. We are doing this through many different facets,” said Cathy Repola, National Executive Director of the Guild. “One of them is this demographics survey, and the information collected from it is being utilized to inform our overall approach.”
Editors Guild President Alan Heim, ACE, added: “We at the Guild have a lot of work to do to get to a better level of equality, diversity, and inclusion. In order to do that work effectively, it is important to have real data on where we are currently, and we appreciate the input from our members who took the survey.”
DISCRIMINATION IN THE WORKPLACE
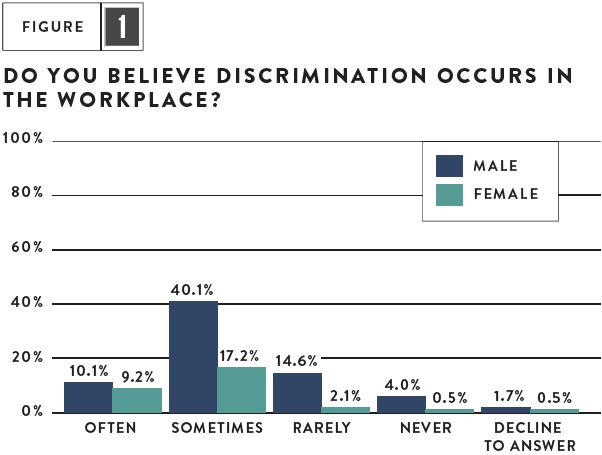
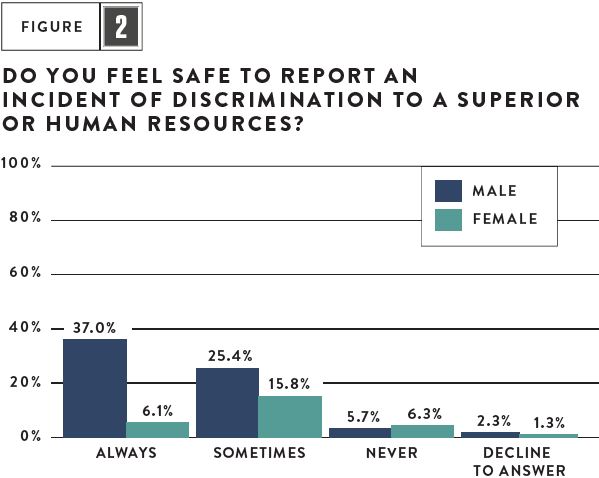
The survey included questions regarding members’ experience with discrimination in the workplace, asking respondents to describe how safe they felt reporting such incidents. According to the survey, 76.6% of the members believe discrimination occurs “often” or “sometimes” in the workplace. [Fig. 1] There was a sharp gender split: 37.0% of males felt safe to report discrimination to a superior or Human Resources, while only 6.1% of females felt safe to do so. [Fig. 2]
At the end of the survey, participants were encouraged to add comments about their own experiences with discrimination in the workplace. More than 800 out of 3,583 participants wrote comments ranging from thank you notes to the Guild for conducting the survey to personal stories about being unable to safely report discrimination and/or harassment. Several respondents described the backlash that they experienced when they spoke out against discrimination and/or harassment.
Repola said, “I see all that is happening regarding the increased awareness of systemic racism and the marginalization of other groups and communities as a real opportunity for the union to act. We must be a leader in making the working lives of all of our members free of the subtleties of microaggressions and hurtful jokes as well as blatant discrimination and harassment that occur in the workplace.”
ETHNIC REPRESENTATION
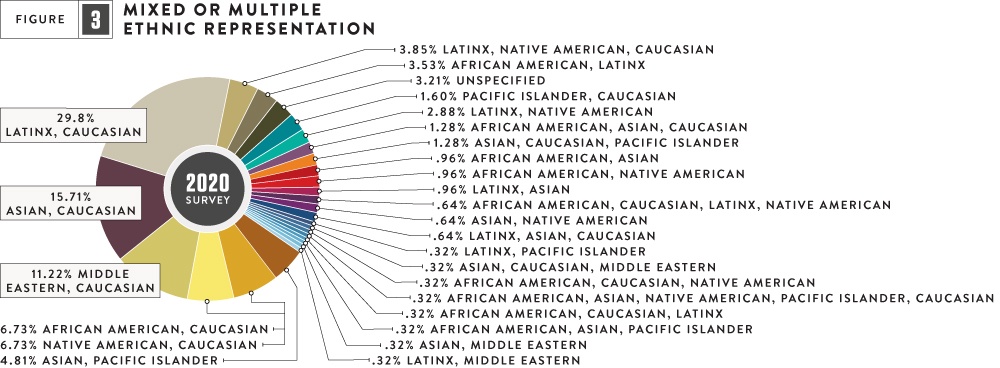
The results of the survey show that the overall makeup of the Editors Guild has only improved marginally over the last four years in terms of ethnic diversity. The 2020 survey was adjusted to track ethnic representation more specifically than a similar survey conducted in 2016—the last time the Guild polled its members about these issues.
The survey is now able to account for members of more ethnicities. [Fig. 3]
 “Asian /Pacific Islander” for example was divided into two separate categories: “Asian” and “Native Hawaiian / Pacific Islander.” And, “Middle Eastern / North African” was added as a new category. [Fig. 4]
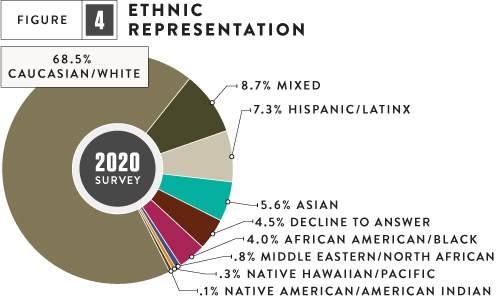
But overall, the comparison between the two surveys shows how little has changed.
GENDER REPRESENTATION
The 2020 survey revealed that 67.99% of members identified as male and 28.50% of members identified as female.
In a similar survey conducted in 2016, 67.71% of members identified as male and 29.53% of members identified as female. While it seems that there is a 1% decrease in female representation from 2016 to 2020, one major change impacting this year’s gender data is the inclusion of diverse identities for gender representation, breaking from “female / male” binary categorization from years past. It is also worth noting that only 2,200 members participated in the survey in 2016, representing a smaller pool of members than those who participated this year.
SEXUAL ORIENTATION
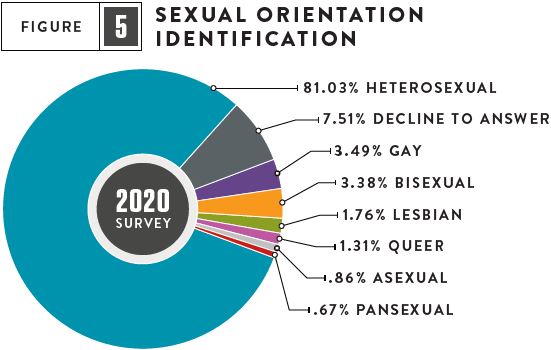
The 2020 LGBTQ+ community accounted for 11.47% of Guild members, according to the survey. More than 81% of the members who responded identified as heterosexual, while 7.51% declined to answer. [Fig. 5]
In the 2017 “Who We Are” Demographics Survey (a shorter survey with only 1,215 member responses, which is a significantly smaller sample rate of overall membership participation compared to this year), LGBTQ+ members accounted for 12.51% of the respondents while 88.97% of the respondents identified as heterosexual.
AGE REPRESENTATION
 The 2020 survey included a question regarding age that 89.54% of participants answered. The lowest age reported was 23 while the highest was 78; 10.46% of participants declined to answer.
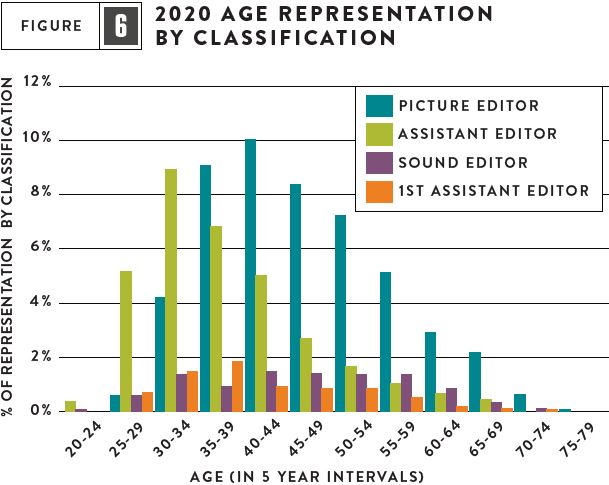
The majority of all Picture Editors reported being within the ages of 40-44, with a steady decline in representation up through age 78. [Fig. 6] The majority of Assistant Editors reported being within the ages of 30-34, with a steady decline in representation ending in the age range of 65-69. Sound Editors appear to have a more consistent level of representation with slight drop-offs between ages 30 to 59. The majority of 1st Assistant Editors surveyed are within the 35-39 age range with fairly even representation between ages 40-54 before declining.
GUILD CLASSIFICATION AND MEDIUM / GENRE
More than 76% of the survey participants work within five major Guild classifications: Picture Editor, Assistant Editor, Sound Editor, 1st Assistant Editor and Re-Recording Mixer.
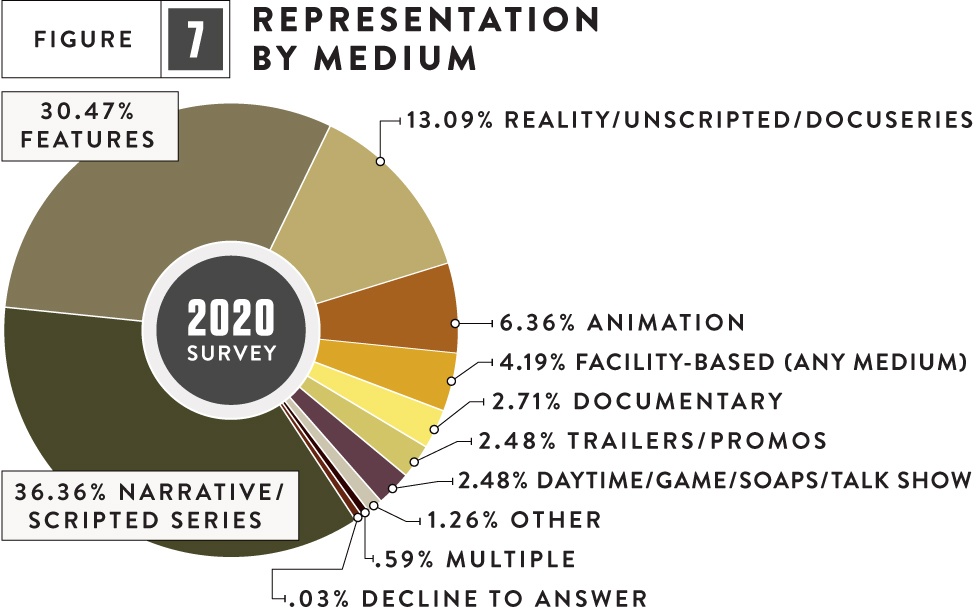
Almost 80% of total members surveyed worked on projects within three primary media: Narrative / Scripted Series, Features, and Reality / Unscripted / Docuseries.
According to the survey, “Narrative/Scripted Series” editors represent the majority of picture editors within the Guild. [Fig. 7] And although only 13.09% of total survey participants stated that they work in the “Reality / Unscripted / Docuseries” genre, they make up the second largest group of picture editors at 24.56%. [Fig. 8] Meanwhile, those who work in Features make up the third largest group of picture editors at 21.28%.
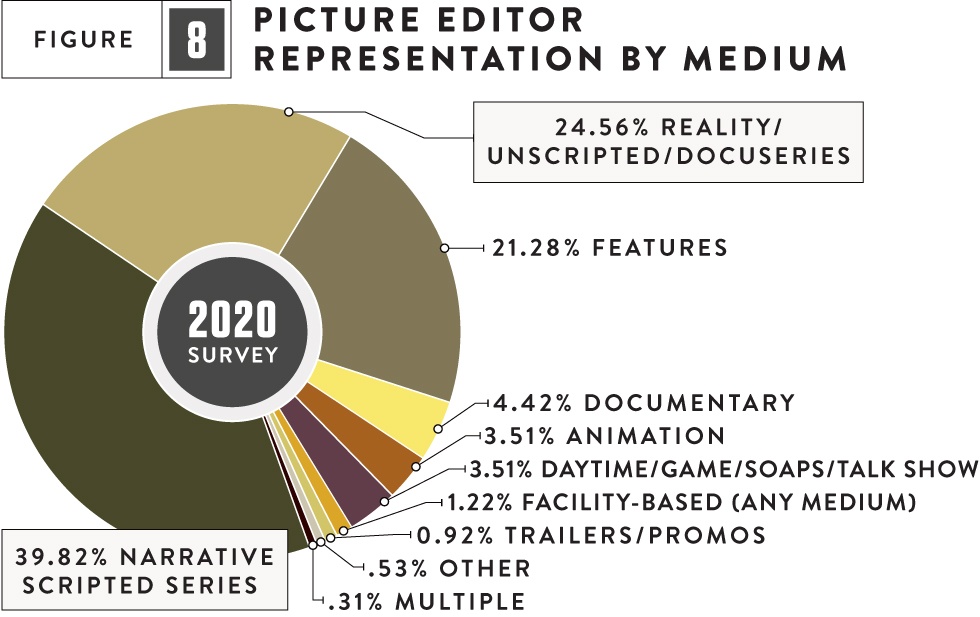
The vast majority of all Assistant Editors surveyed primarily work on Narrative / Scripted Series projects, at 51.02%.
86.84% of Sound Editors who responded work within either Features or Narrative / Scripted Series. 63.08% of those who identified as 1st Assistant Editors worked primarily on Features.
 PAY RATE
The survey included an open-ended question where participants were able to voluntarily input their daily or weekly pay rate. 2925 participants wrote an answer for this question, however only 2435 of those entries provided valid answers based on the question asked. For those who provided a daily rate, that amount was converted to a weekly rate, based on an average 5-day work week. A few participants answered the question by providing an hourly rate, which could not be effectively translated into a weekly rate given lack of information such as guaranteed weekly hours, or guaranteed work-days. As a result, that hourly rate data was inconclusive and unable to be included in this analysis. The participants who stated that they were working, “scale,” also could not be included in this analysis due to lack of information, as tier level varies from project to project. Some participants interpreted the question as if they were being asked if they were being paid weekly or daily, with nearly all of those answers reporting that they indeed were being paid weekly.
The number of valid entries still represented 68% of the survey participants. These valid entries provide the basis for the following pay rate analysis. It is to be noted that, this information is personally provided and anonymous self-reporting and therefore not an accurate reflection of an actual scientific or mathematical analysis of real wages or salary.
Editors working on “Features” represent the smallest group of Picture Editors at 21.28%. However, their members rank amongst the highest paid group overall with the majority (52.5%) being paid $3,000 – $5,500 per week. [Fig. 9] (The lowest salary reported in this category was $1,000. The highest was $23,500.)
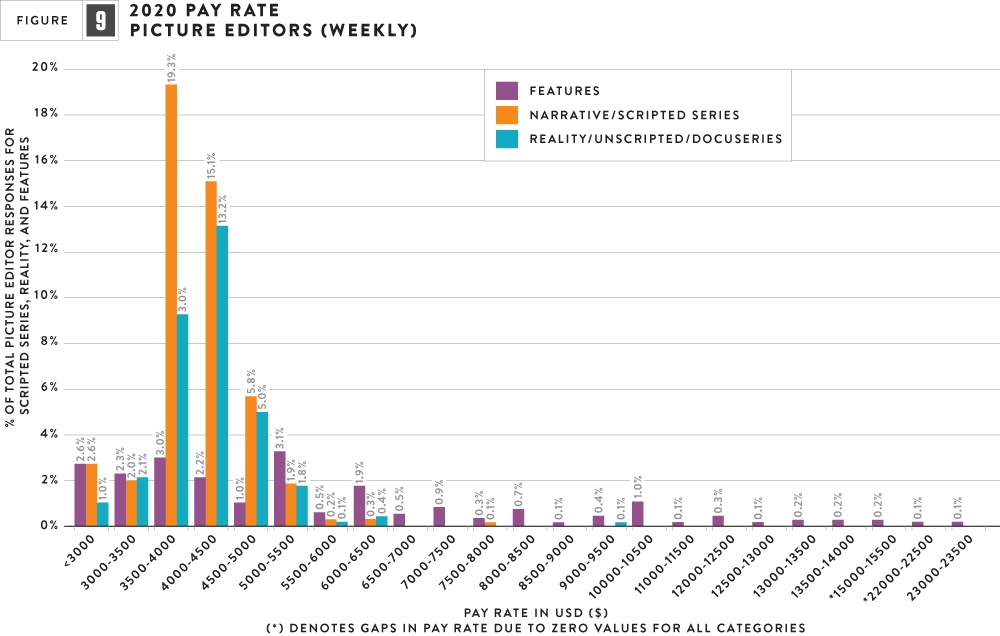 The “Narrative / Scripted Series” editors represent the largest group of Picture Editors at 39.82% with the majority being paid between $3,500-$4,000 per week. [Fig. 9] (The lowest weekly salary reported in this category was $1,000 per week. The highest was $7,500.)
The “Reality / Unscripted / Docuseries” editors represent the second largest group of Picture Editors 24.56%, with the majority being paid between $4,000-$4,500 per week. [Fig. 9] (The lowest weekly salary reported in this category was $1,500. The highest was $9,000.)
The “Narrative / Scripted Series” Assistant Editors rep-resent the largest group of Assistant Editors at 51.02%, with the majority being paid between $2,000 to $2,250 per week. [Fig. 10] (Their highest reported pay was $3,800.)
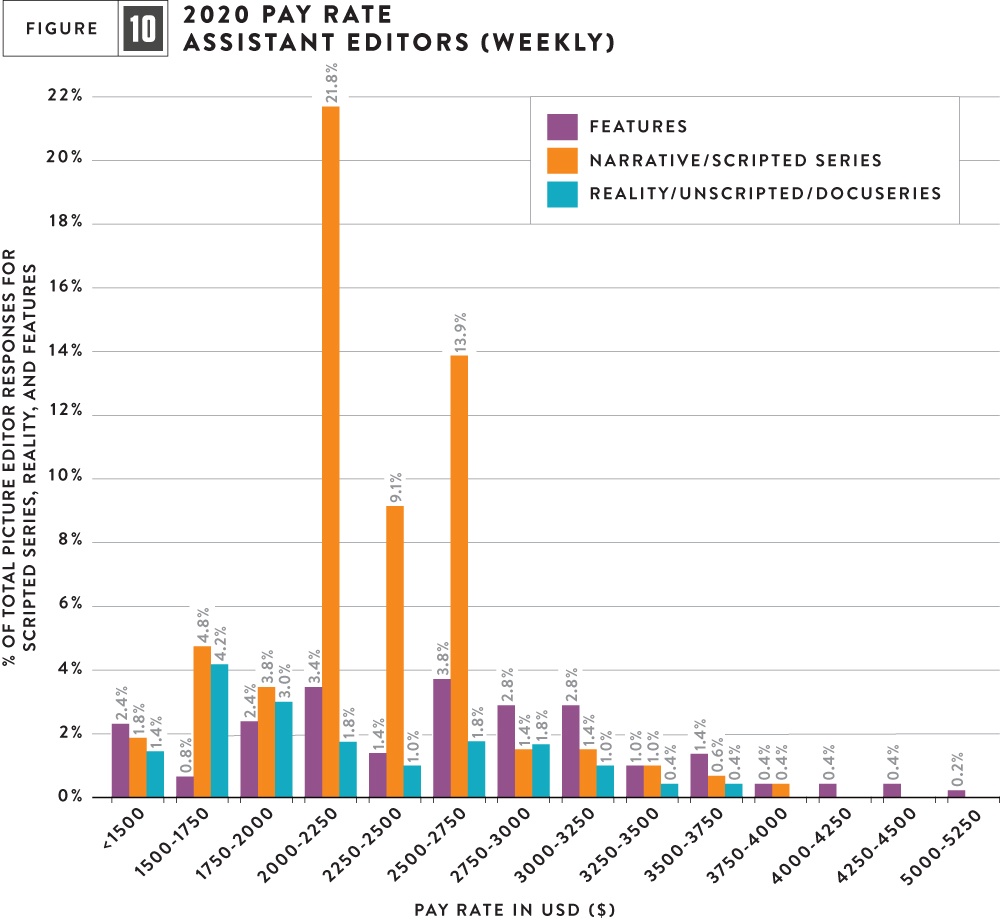
Assistant Editors who work on “Features” are the second largest group of Assistant Editors at 20.34%, with the majority being paid between $2,000 and $3,250 per week. [Fig. 16] (The highest reported salary was $5000 per week.)
“Reality / Unscripted / DocuSeries” Assistant Editors make up the third largest group of Assistant Editors at 12.76%, with the majority being paid between $1,500 – $2,000 per week. (The highest reported salary was$3,500.) [Fig. 10]
Sound Editors made up 7.42% of the all the members who responded, representing the third largest group of participants of the survey.
48.87% of the Sound Editors work on “Features,” with 73.33% of those Sound Editors being paid between $2,200 and $3,200 per week. (The lowest reported weekly rate is $850, and the maximum is $5,000.) [Fig. 11]
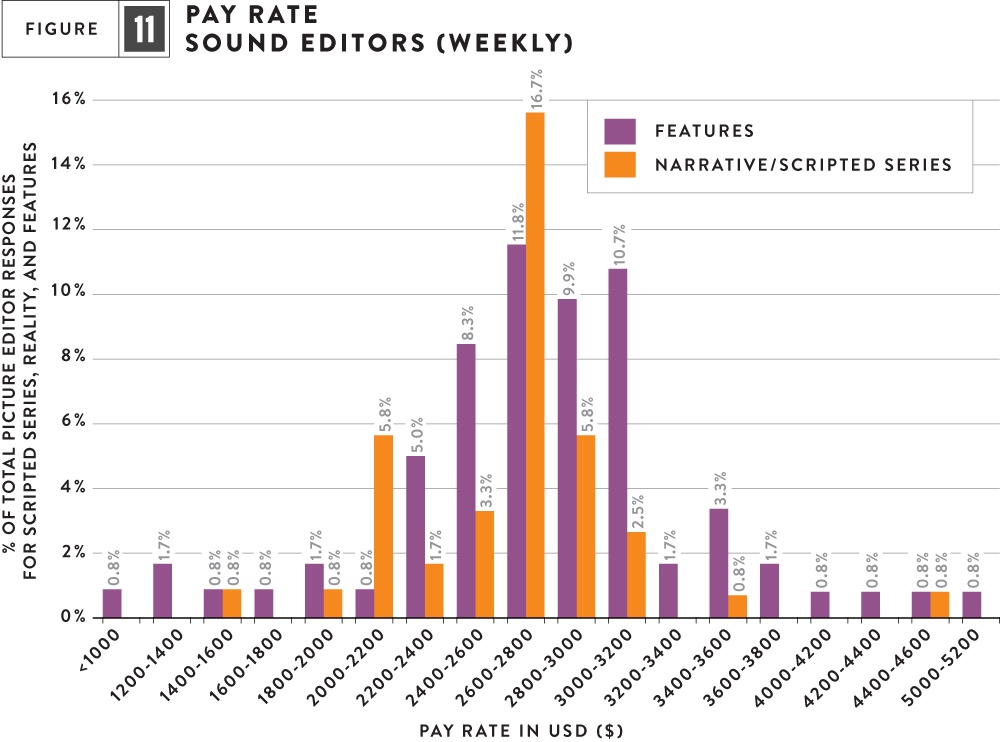
37.97% of all Sound Editors work on “Narrative / Scripted Series” projects, with 71.74% of those Sound Editors being paid between $2,400 and $3,200 per week. (The lowest reported weekly rate is $1,488 and the maximum is $4,500 per week.) [Fig. 11]
None of the Sound Editors surveyed were represented on “Reality / Unscripted / Docuseries” projects because those Picture Editors in that medium, are primarily responsible for their own sound editing.
THE FUTURE
Diversity Committee Co-chairs Lillian Benson and Maysie Hoy asserted in a joint statement: “The next step for the Editors Guild is to utilize the data the survey provided to support important conversations and create initiatives which can lead to concrete actions that impact justice, equality, diversity and inclusion for our membership.”

“I am so proud to be part of this union’s leadership team, one that not only acknowledged we need to play a key role in the long overdue changes that need to take place, but one that also fully embraced with conviction the work we need to do to accomplish this,” Repola said.
Tricia Rodrigo is a Picture Editor who actively participates in the Editors Guild as a member of the Pan Pacific Asian Steering Committee and the Women’s Steering Committee.

